
Average Website Exit Rate: What’s a Good Exit Rate for a Website?

You open your website analytics and notice that visitors are leaving certain pages at a surprisingly high rate. Naturally, the next question is: Is my website exit rate too high?
Understanding the average website exit rate can help you identify pages where visitors frequently end their sessions. But there isn't one universal number that tells you whether your website is performing well or poorly.
So, what is a good exit rate for a website?
The answer depends on the type of page, your industry, where your visitors came from, and what you want them to do next. A high exit rate on a blog post may be completely normal, while a high exit rate on a checkout or lead-generation page could indicate that visitors are encountering friction.
That's why an average website exit rate benchmark should be treated as a starting point rather than a target you need to hit.
In this guide, we'll explain what website exit rate means, how exit rate differs from bounce rate, how to interpret exit-rate benchmarks by page type, how to find and measure exit behaviour in Google Analytics 4, and the most common reasons visitors leave websites.
We'll also cover ways to reduce unnecessary exits and improve the overall visitor experience, so you can use your analytics to make smarter website decisions instead of simply chasing a lower percentage.
If you're also focused on turning website visitors into leads or customers, our guide on What Is a Good Website Conversion Rate? can help you understand how conversion performance fits into the bigger picture.
For a broader look at measuring website performance, you can also explore our Ultimate Guide to Google Analytics 4.

What Is Website Exit Rate?
Average website exit rate is a useful Google Analytics metric for understanding where visitors are leaving your website. It can help identify pages where users commonly end their sessions and provide clues about whether certain pages need improvements to content, navigation, user experience, or conversion paths.
However, a high exit rate does not automatically mean a page is performing poorly.
Visitors have to leave your website eventually. The more important question is where they leave, why they leave, and whether leaving at that point makes sense for the visitor journey.
A visitor exiting after completing a purchase is very different from a visitor landing on a service page, finding it confusing, and leaving without taking the next step.
Website Exit Rate Definition
The website exit rate represents the percentage of website sessions in which a particular page was the final page viewed before the visitor left your website.
In other words, exit rate answers a simple question: Of the visits that included this page, how often was this the last page the visitor viewed?
For example, imagine your website receives 1,000 sessions that include your pricing page. If 300 of those sessions end on the pricing page, that page has an exit rate of 30%.
This does not necessarily mean that 30% of visitors were dissatisfied with the pricing page. Some may have reviewed your pricing, decided they had enough information, and left. Others may have contacted you, bookmarked the website, or simply finished researching.
Exit rate becomes much more useful when you compare it with the purpose of the page and the expected next step.
A blog post designed to answer a specific question may naturally have a relatively high exit rate. A checkout page should also eventually end a session, although you would generally want to examine whether visitors complete their purchase before leaving.
A service page, on the other hand, may be designed to move visitors toward a contact form, phone call, booking page, or another service page. If many visitors leave before taking that next step, the exit rate may be worth investigating.

How Is Exit Rate Calculated?
The website exit rate definition measurement is based on the number of exits from a page compared with the number of sessions that included that page.
The basic website exit rate formula is:
Exit Rate = Number of Exits From a Page ÷ Number of Visits to the Page × 100
For example, suppose 500 sessions included a specific service page and that page was the final page viewed in 100 of those sessions.
Using the how is exit rate calculated formula:
100 ÷ 500 × 100 = 20% exit rate
That means 20% of the sessions that included that page ended on that page.
It is important to remember that exit rate is calculated based on sessions that included the page, not simply the number of people who landed on the page first.
This distinction becomes particularly important when analyzing the difference between exit rate and bounce rate.
What Does an Exit Mean in Website Analytics?
So, what does exit rate mean when you're looking at your website analytics?
An exit means that a visitor's session ended after viewing a particular page.
That visitor could have spent five seconds on the page or five minutes. They could have found exactly what they needed or left because they could not find the information they wanted. The metric itself does not tell you which scenario occurred.
This is why exit rate should be treated as a diagnostic metric rather than a standalone performance score.
For example, consider an online clothing store.
A customer might visit the homepage, browse a category page, open a product page, add an item to their cart, complete checkout, and then leave the website. The final page in that journey will naturally have exits.
Now consider a customer who visits a product page, cannot find sizing information, struggles to understand shipping costs, and leaves without purchasing. That exit may point to an opportunity to improve the page.
The number alone does not explain the reason for the exit. You need to look at the page's purpose, traffic source, user behaviour, conversions, and other analytics data to understand what is happening.

What's The Difference Between Bounce Rate and Exit Rate?
The difference between exit rate and bounce rate comes down to how the visitor's session began and how many pages they viewed.
Exit rate looks at the percentage of sessions that ended on a particular page, regardless of whether that page was the first page the visitor viewed.
Bounce rate focuses on sessions where the visitor did not have an engaged session according to Google Analytics 4's engagement-based definition. In practical terms, it helps identify visits where the user did not meet Google's criteria for an engaged session.
This means a visitor can enter your website through one page, browse several other pages, and eventually exit from another page. That final page contributes to its exit rate but does not automatically represent a bounce.
For example, imagine this visitor journey:
Homepage → Services → Pricing → Contact → Exit
The visitor viewed four pages before leaving. The Contact page counts as the exit page, but this was not a one-page visit.
Now imagine another visitor does this:
Services → Exit
If that session does not meet Google Analytics 4's criteria for an engaged session, it may be recorded as a bounce. The Services page is also the exit page because it was the final page viewed.
This is why you should not treat bounce rate and exit rate as interchangeable metrics.
For a deeper explanation of bounce rate, see our guide to Average Website Bounce Rate.
Understanding the exit rate vs bounce rate relationship can help you avoid one of the most common website analytics mistakes: assuming that every visitor who leaves a page immediately "bounced."

Source: Data from Databox – Exit Rate vs. Bounce Rate.
What Is the Average Website Exit Rate?
If you're looking at your analytics and wondering whether your website's exit rate is normal, the first thing to understand is that there is no single number that applies to every website.
Exit rates can vary significantly depending on the type of website, the purpose of the page, the traffic source, the industry, and where the page sits within the customer journey.
Based on the benchmark data available for this analysis, exit rates were distributed as follows:
Exit Rate (%) | Percentage of Responses |
0–25% | 28.21% |
26 - 40% | 28.21% |
41 - 55% | 17.95% |
56 - 70% | 10.26% |
Over 70% | 2.56% |
Unsure | 12.82% |
The largest groups reported exit rates between 0–25% and 26–40%, with each range representing 28.21% of responses.
However, these figures should be treated as a general reference point rather than a universal industry standard. The "right" exit rate for your website depends heavily on what visitors are expected to do on each page.
For example, an informational blog post may naturally have more exits because a visitor can find the answer they need and leave. A checkout page can also have a high exit rate because completing the customer journey eventually means leaving the site.
A service page with a high exit rate may deserve more investigation if visitors are expected to contact the business, request a quote, book an appointment, or continue to another page.
Is There a Universal Average Website Exit Rate?
There is no universal average website exit rate that every website should aim for.
While benchmark data can give you a useful starting point, an exit rate website metric needs to be interpreted within the context of the page being measured.
A website with a large blog section, for example, may have very different exit behaviour from an e-commerce store. A visitor reading a 2,000-word educational article may have no reason to visit another page after finding the information they needed.
Compare that with an e-commerce product page.
If visitors regularly view a product, fail to add it to their cart, and leave the website, the exit rate may be more meaningful when combined with add-to-cart rates, product engagement, checkout behaviour, and conversion data.
The same principle applies to service businesses.
A visitor may land on a plumbing service page, read about the service, find the phone number, and call the business. From an analytics perspective, the visitor may still eventually exit the website, even though the website successfully helped generate a lead.
This is why a website exit rate benchmark should be used as a reference rather than a pass-or-fail threshold.

Source: Data from Databox – Google Analytics Exit Page Analysis.
What Is a Good Website Exit Rate?
So, what is a good exit rate for a website?
A good exit rate is one that makes sense for the purpose of the page and the visitor journey.
There is no specific percentage that automatically makes an exit rate good or bad.
For one page, a 60% exit rate could be completely reasonable. For another, a 60% exit rate could indicate that visitors are not moving toward an important conversion.
Consider a blog article explaining how to choose the right type of roofing material. A visitor may read the article, get the information they were looking for, and leave without visiting another page. A relatively high exit rate does not automatically indicate a problem.
Now consider a roofing company's quote-request page.
If visitors reach the page but frequently leave without submitting the form, the business should investigate whether the form is too long, the offer is unclear, the page lacks trust signals, or visitors have unanswered questions.
The difference is page intent.
Your goal should not necessarily be to drive your exit rate as low as possible. Trying to eliminate exits entirely would not make sense because visitors eventually have to leave your website.
Instead, look for unexpected exits.
An unexpected exit happens when visitors leave at a point where you would reasonably expect them to continue. These exits can reveal opportunities to improve your content, navigation, calls to action, page layout, mobile experience, or overall conversion path.
Your average website exit rate can therefore be useful as a starting benchmark, but your own historical data is often more valuable.
Compare similar pages against each other. Look at how exit rates change after major website updates. Segment visitors by device and traffic source. Most importantly, connect exit behaviour to actual business outcomes such as leads, purchases, bookings, phone calls, and other conversions.
The goal isn't to achieve a magic exit-rate percentage.
The goal is to build a website where visitors can find what they need, understand what you offer, and take the next logical step.

The benchmark data referenced in this section is sourced from CXL’s Bounce Rate Benchmarks.
Average Exit Rate by Page Type
Looking at the average website exit rate by page type can make analytics data much easier to interpret.
A 70% exit rate does not mean the same thing on every website. A blog post, landing page, ecommerce product page, and lead-generation page can have completely different visitor journeys and conversion goals.
The ranges below are useful as general reference points, not strict industry standards. Your actual website data should always be interpreted alongside page purpose, traffic source, device, engagement, and conversions.
Average Exit Rate for Landing Pages: 60% - 90%
Landing pages can naturally have a relatively high exit rate because they are often designed around a single action.
A visitor may arrive from a Google Ad, social media campaign, email, or another marketing channel, review the offer, and either convert or leave. If the visitor does not continue to another page, that landing page becomes the exit page for the session.
An average page exit rate in the 60%–90% range can therefore occur on landing pages without automatically indicating poor performance.
The more important question is whether visitors are completing the action the page was designed to generate.
For example, imagine a Calgary home renovation company creates a landing page for a free kitchen renovation consultation. The page has one primary goal: get visitors to submit a consultation form.
If the page has a 75% website exit rate, that number alone does not tell you whether the page is successful.
If visitors who exit have already submitted the form, the page may be doing exactly what it was designed to do. If most visitors leave without submitting the form, however, the business should investigate the page's offer, messaging, trust signals, form experience, mobile design, and calls to action.
For landing pages, conversion rate and exit behaviour should be analyzed together.
Average Exit Rate for Small Businesses: 30% - 45%
For small-business websites, an exit rate in the 30%–45% range can serve as a general reference point, but there is considerable variation depending on the business model and website structure.
A local service business may have visitors move between several pages before contacting the company.
A restaurant may have visitors check the menu, hours, location, and reservation information before leaving.
A professional service company may have visitors read several service pages before submitting an inquiry.
This means an average exit rate website benchmark should never be evaluated without considering how customers actually use the website.
On the other hand, if visitors consistently leave from an important service page without viewing the company's contact information, pricing, process, or related services, that could indicate an opportunity to improve the page.
When evaluating the average exit rate for websites, small businesses should focus less on achieving a specific percentage and more on whether important pages are successfully moving visitors through the customer journey.
Average Exit Rate for E-Commerce: 20% - 45%
E-commerce websites require a slightly different approach because visitors often move through a defined purchasing journey.
A customer may browse a category, view several products, add an item to their cart, review shipping information, and proceed through checkout.
When asking what is a good website exit rate for e-commerce, the answer depends heavily on where the exit occurs.
A 40% exit rate on an informational product guide may be perfectly reasonable. The same rate on a checkout step could deserve closer attention, particularly if visitors are abandoning the purchasing process before completing their order.
For ecommerce businesses, look at exit rates alongside metrics such as product views, add-to-cart activity, checkout progression, purchases, and revenue.
For example, if a product page has a high exit rate but also generates a strong add-to-cart rate, the exit rate may not be the biggest concern. If visitors are frequently viewing products but leaving before adding anything to their cart, the business may need to investigate product information, pricing, shipping details, trust signals, imagery, or the purchase experience.
The key is to identify where visitors are leaving within the buying journey rather than treating the website's overall exit rate as one number.
Average Exit Rate for B2B and Lead Generation Websites: 25% - 55%
B2B and lead-generation websites often have longer decision-making processes, which can make exit behaviour more difficult to interpret.
A visitor may read several pages, return to the website later, compare services, review case studies, and eventually contact the company. Another visitor may leave after a single visit because they are still researching their options.
A range of 25%–55% can therefore provide a useful reference when evaluating what is a good exit rate, but the page's role in the lead-generation process matters more than the benchmark itself.
For example, a commercial construction company might have visitors move from a service page to an industries page, review past projects, read a case study, and then visit the contact page.
If visitors frequently exit from a case study after reading it, that may be completely normal. If they consistently leave from the contact page before completing an inquiry form, the business may want to examine the form and conversion experience.
B2B websites should also consider the difference between immediate conversions and assisted conversions. A visitor who leaves without submitting a form may return days later through another channel and become a customer.
This is why exit rate should be evaluated alongside lead volume, conversion paths, returning visitors, engagement, and other available attribution data.
Average Exit Rate for Blogs: 65% - 90%
Blogs can naturally have some of the highest exit rates because many articles are designed to answer a specific question.
Someone might search Google for "how often should I replace my furnace filter," click an article, find the answer, and leave. From the website's perspective, that is an exit. From the visitor's perspective, the website may have successfully answered their question.
This is an important consideration when asking what is a normal exit rate for a blog.
A blog article with an 80% exit rate is not automatically performing poorly. The article could be attracting highly relevant organic traffic, generating strong engagement, building brand awareness, earning backlinks, or introducing potential customers to the business.
However, a high exit rate can become more concerning when visitors are expected to take another action.
For example, a digital agency might publish an article about website redesign costs. The article could answer the reader's questions and then direct them toward a website design service page, portfolio, consultation, or contact form.
If almost everyone leaves without engaging with any relevant next step, there may be an opportunity to improve the article's internal linking, calls to action, content structure, or conversion path.
This is where analytics becomes much more valuable than a single benchmark.
Instead of asking whether your blog has a "good" exit rate, ask whether the article is achieving its intended purpose.
A blog can successfully generate organic traffic and answer a search query while still having a high exit rate. Likewise, a lower exit rate does not automatically mean that the content is generating more leads or revenue.

How to Find and Measure Exit Rate in Google Analytics 4
If you want to understand where visitors are leaving your website, Google Analytics 4 (GA4) can still provide useful data. However, there is one important distinction to understand:
GA4 does not display a traditional Exit Rate metric.
Unlike Universal Analytics, GA4 moved away from the standard Exit Rate metric and instead focuses on events, sessions, engagement, and user behaviour. This means you won't simply find an “Exit Rate” column in the Pages and Screens report.
That doesn't mean you can't identify where visitors are leaving. You just need to use other GA4 data and methods to understand exit behaviour.
Does Google Analytics 4 Show Exit Rate?
If you're searching for Google Analytics exit rate, you may notice that GA4 doesn't provide a standard Exit Rate percentage for each page.
The Pages and Screens report can show you how many views and users individual pages receive, along with metrics such as engagement and conversions. However, it does not give you the traditional percentage of sessions that ended on each page.
This is an important difference when comparing older Universal Analytics reports with GA4.
Rather than looking for one specific exit rate GA4 metric, you can use GA4's available session and page data to investigate where visitor journeys are ending.

How to Find an Exit Page in Google Analytics
To identify an exit page, Google Analytics users can start by reviewing the Pages and Screens report.
In GA4, go to Reports → Engagement → Pages and Screens. From here, you can review individual pages and examine metrics such as views, users, engagement time, and conversions.
While this won't directly tell you how many sessions ended on each page, it gives you valuable context about how visitors interact with those pages.

For more detailed analysis, you can also use Explore in GA4 to create custom reports and examine user journeys, page paths, and session behaviour. This can help you identify pages that frequently appear at the end of a visitor's journey.
If you're new to GA4, our Beginner's Guide to Google Analytics walks through the platform and explains the core reports and metrics you need to understand your website performance.
How to Calculate Exit Rate Without a GA4 Exit Rate Metric
Because GA4 doesn't provide a standard Exit Rate metric, you can calculate an estimated exit rate when you have the appropriate page and session data.
The traditional calculation is:
Exit Rate = Exits From a Page ÷ Visits to That Page × 100
For example, if 1,000 sessions include a particular page and 300 of those sessions end on that page, the calculated exit rate would be 30%.
The challenge is obtaining the number of exits from a specific page in GA4. Depending on the level of analysis you need, this may require a custom exploration, BigQuery export, another analytics platform, or a reporting tool connected to your GA4 data.
This is why you shouldn't expect to open a standard GA4 report and see an average exit rate Google Analytics metric ready to use.
Even without a built-in Exit Rate metric, GA4 can still help you understand where visitors stop interacting with your website.
Look for pages that receive substantial traffic and then compare their engagement, conversions, page paths, and position within the visitor journey.
For example, suppose a large number of visitors reach your pricing page but relatively few continue to your contact or booking page. That could be a reason to investigate the page further.
On the other hand, a blog post that frequently ends a visitor's session may not have a problem at all. Someone may have found the information they needed and simply left the website.
The goal is to identify unexpected exits, not to eliminate exits altogether.
Our guide to Top Digital Marketing Metrics to Track covers other important metrics you can use alongside your GA4 data to understand how your website is performing.

Why Is My Website Exit Rate So High?
Seeing a high exit rate in your website data can be concerning, but the percentage alone doesn't tell you whether something is wrong.
There isn't one normal website exit rate that applies to every page or business. A page designed to provide a quick answer may naturally have more visitors leave than a page designed to generate leads or complete a purchase.
The better question isn't simply, “Is this a good website exit rate?”
Instead, ask: Why are visitors leaving this particular page?
If you're asking, "Why is my website exit rate so high?", the answer could be anything from a slow-loading website to poor navigation, a frustrating mobile experience, or simply the fact that visitors found exactly what they needed.

Slow Website Loading Speed
Website speed is one of the first things to investigate when you notice a high exit rate.
When a page takes too long to load, visitors may leave before they ever see your content, products, services, or calls to action. Every additional second of waiting can create more opportunities for someone to abandon the page.
Slow loading can be caused by large images, unnecessary plugins, excessive scripts, poor hosting, third-party tools, or other technical issues.
If you're trying to determine what is a good website exit rate, make sure you're also looking at the experience visitors have before they reach the content. A slow website can influence both engagement and whether someone continues browsing.
Our Average Website Site Speed guide covers website loading times and the factors that can affect your site's performance.
Understanding why users leave websites starts with understanding how quickly the website gives them access to what they came for.
Poor Website Navigation
Visitors shouldn't have to work hard to figure out where to go next.
If your navigation is confusing, inconsistent, overloaded with options, or missing important pages, visitors may simply give up and leave instead of continuing through your website.
This can be particularly problematic for service businesses. Someone might land on a service page ready to learn more, but if they can't easily find pricing, examples, contact information, or the next step, the opportunity can disappear.
Clear navigation helps visitors understand where they are, what information is available, and where they can go next.
Our guide to Website Navigation Best Practices covers how to structure your navigation so visitors can move through your website more easily.
Poor navigation is one of the common reasons people leave websites, especially when visitors already have a specific goal in mind.

Poor Mobile Experience
A website that looks great on a desktop computer can still provide a frustrating experience on a smartphone.
Text that is difficult to read, buttons that are too small, menus that are difficult to use, horizontal scrolling, overlapping elements, and slow mobile loading can all create friction.
Since many businesses receive a significant portion of their traffic from mobile devices, a poor mobile experience can contribute to a high website exit rate.
Check your most important pages on multiple screen sizes rather than assuming your website works properly because it looks good on your own device.
Pay particular attention to pages where visitors are expected to take action, such as contact forms, booking pages, product pages, and checkout screens.
Content Doesn't Match Search Intent
Sometimes the problem isn't the website itself. It's the gap between what the visitor expected to find and what the page actually provides.
For example, someone searching for “website design cost in Calgary” may expect to find pricing information, package details, or an explanation of what affects website costs.
If they click a result that promises pricing but land on a generic page with no pricing information, they may leave immediately.
This mismatch between search intent and page content can contribute to a high website exit rate, particularly for pages receiving organic search traffic.
Your page should deliver on the promise made by its title, search result, advertisement, or referring link.

Too Many Pop-Ups or Interruptions
Pop-ups can be useful when they're presented at the right time and provide something genuinely helpful.
The problem starts when visitors are constantly interrupted.
A visitor might land on a page and immediately see a newsletter pop-up, cookie notification, promotional banner, chat window, or other overlay before they've had a chance to understand the content.
If several interruptions appear throughout the experience, visitors may become frustrated and leave.
This is another reason to consider when investigating a high exit rate. Instead of asking only why do people leave websites, consider whether your website is giving visitors enough uninterrupted time to find what they need.
If a pop-up isn't helping visitors or supporting your website's goals, test whether removing it improves engagement and conversions.
Visitors Found Exactly What They Needed
Not every exit is a problem.
In fact, some pages are designed to give visitors an answer and naturally end their journey.
Imagine someone searches for your business's phone number, finds it on your contact page, and leaves. Or someone reads a blog post that completely answers their question and then closes the browser.
In these situations, a high page exit rate may simply reflect that the visitor accomplished their goal.
This is why you shouldn't automatically change a page just because its exit rate is higher than another page.
Instead, look at the page's purpose, traffic source, engagement, conversions, and the action you actually want visitors to take.
A high exit rate becomes much more meaningful when visitors are leaving before completing an important action.
The goal isn't to make every visitor stay on your website longer. It's to make sure visitors can find what they need and take the next logical step when one exists.

How to Reduce Website Exit Rate
Once you've identified pages with unusually high exit rates, the next step is figuring out what you can actually improve.
Learning how to reduce exit rate isn't about forcing visitors to stay on your website longer. It's about removing unnecessary friction, improving the visitor experience, and making it easier for people to take the next logical step.
Before making changes, look at the purpose of the page, where visitors came from, what they were likely looking for, and what you want them to do next.

Understand the Purpose of Each Page
Every page on your website should have a clear job.
A service page might be designed to generate inquiries. A product page might be designed to encourage a purchase. A blog post might be designed to answer a question and introduce visitors to related content.
Once you understand the purpose of a page, you can determine whether its exit rate is actually a concern.
For example, a contact page may naturally have a higher exit rate because visitors submit a form, find your phone number, or decide they don't need anything else from the website.
On the other hand, if visitors consistently leave a service page without contacting you, viewing another page, or taking another meaningful action, there may be an opportunity to improve the experience.
Start with the question: What should a visitor reasonably do after viewing this page?
Then make that next step obvious.

Improve Website Navigation
Your website should make it easy for visitors to find their way around.
Review your main navigation and make sure the most important pages are easy to access. Visitors shouldn't have to hunt through multiple pages to find your services, products, pricing, contact information, or other important information.
You can also improve navigation within individual pages by adding relevant internal links and clear calls to action.
For example, a service page could naturally direct visitors toward related services, case studies, pricing information, or a contact page.
The goal isn't to add as many links as possible. It's to give visitors useful next steps that make sense based on what they're currently viewing.
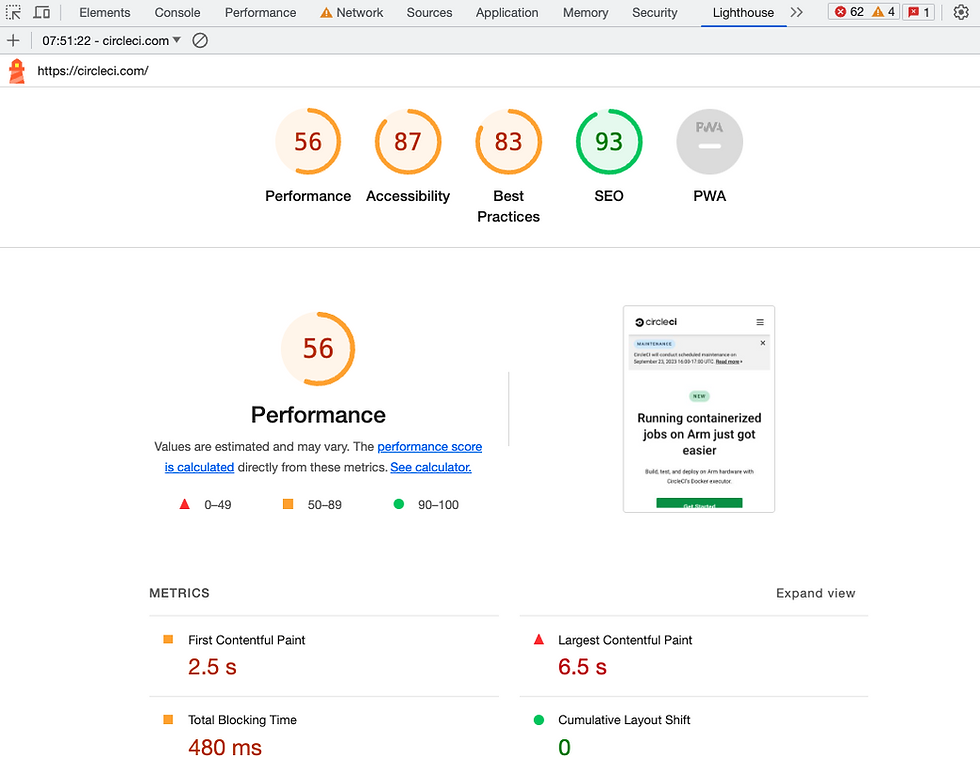
Improve Page Speed
A slow website creates friction before visitors even have a chance to engage with your content.
Compress large images, remove unnecessary scripts and plugins, improve hosting where necessary, and make sure important pages load quickly across both desktop and mobile devices.
Pay particular attention to pages receiving significant traffic. Improving the speed of your most visited pages can have a much larger impact than optimizing pages that receive very little traffic.
Our Site Speed Optimization Ultimate Guide covers the key factors that affect website performance and the practical steps you can take to improve loading speed.
Improve Content Relevance
If someone arrives on a page expecting one thing and finds something completely different, they're more likely to leave.
Make sure your page title, headings, advertisements, search listings, and referring links accurately represent what visitors will find on the page.
Then make sure the content actually answers the questions or solves the problem that brought them there.
For example, if a page targets someone searching for “website design pricing,” the page should provide useful information about website costs, what affects pricing, what is included, and what the visitor can do next.
Don't make visitors dig through unrelated information before getting to the answer they're looking for.
Relevant content gives visitors a reason to keep reading, explore another page, or take action.

Improve Mobile UX
Your website needs to work just as well for visitors on smartphones as it does on desktop computers.
Review your website on different screen sizes and look for anything that makes the experience difficult or frustrating.
Check whether text is easy to read, buttons are easy to tap, menus work properly, forms are simple to complete, images display correctly, and important information is visible without excessive scrolling.
Pay particular attention to your highest-value pages, including service pages, product pages, landing pages, contact forms, and checkout pages.
A smoother mobile experience can remove some of the friction that causes visitors to leave before completing an important action.
Ultimately, reducing exit rate comes down to creating a website that respects the visitor's time and makes their next step clear.
When visitors can quickly find what they need, understand your offer, and move through your website without unnecessary friction, you're addressing the underlying problems that can cause unwanted exits.
Conclusion
Understanding your average website exit rate can give you useful insight into how visitors move through your website, but the number should never be viewed in isolation.
A high exit rate doesn't automatically mean a page is performing poorly. Visitors may leave because they found exactly what they needed, completed an action, or reached the natural end of their journey.
The more important question is what a good page exit rate is for the specific page you're analyzing and whether visitors are completing the action that page was designed to support.
Instead of trying to make your exit rate as low as possible, look for unexpected exit points. Compare exit behaviour with engagement, conversions, traffic sources, page speed, mobile experience, and other website metrics to understand what may be happening.
You can also review your Average Website Session Duration to better understand how long visitors are engaging with your website, rather than relying on a single metric.
If you're looking to understand your website analytics more broadly, our Ultimate Guide to Google Analytics 4 can help you learn how to use GA4 data to make more informed decisions about your website and digital marketing.
Ultimately, website analytics isn't about chasing a perfect number. It's about using the data to understand how people interact with your website, identify opportunities for improvement, and create a better experience for the people you're trying to reach.
Frequently Asked Questions (FAQs)
What is the average website exit rate?
There is no single average website exit rate that applies to every website or page type. Exit rates vary depending on the page's purpose, industry, traffic source, and where the page appears in the visitor journey. A blog post may naturally have a higher exit rate than a checkout or lead-generation page.
How do you calculate exit rate?
Exit rate is calculated by dividing the number of sessions that ended on a specific page by the total number of sessions that included that page, then multiplying by 100.
Exit Rate = Exits From a Page ÷ Visits to That Page × 100
For example, if 1,000 sessions included a page and 300 of those sessions ended on that page, the calculated exit rate would be 30%.
What is considered a high website exit rate?
A high website exit rate depends on the type and purpose of the page. A rate above 70% may be worth investigating on some conversion-focused pages, while a similar rate may be completely normal for certain blog posts or informational pages.
Instead of using one percentage as a universal threshold, look for exit rates that are unusually high compared with similar pages or that occur before visitors complete an important action.
What's the difference between bounce rate and exit rate?
Bounce rate measures sessions where a visitor leaves without meeting Google's criteria for an engaged session, while exit rate looks at the percentage of sessions that ended on a specific page.
For example, a visitor could navigate from your homepage to a service page and then leave. The service page is an exit page, but the session may not have been a bounce because the visitor interacted with more than one page.
How common is a 50% website exit rate?
A 50% website exit rate can occur frequently, but whether it is normal depends on the page and website being analyzed. A 50% exit rate means that roughly half of the sessions that included that page ended there.
For some informational pages, that may be expected. For a key conversion page where visitors are expected to continue to a form, booking process, or checkout, it may be worth investigating.
What does a high exit rate tell you about a website?
A high exit rate tells you that a significant percentage of sessions ended on that particular page. It does not, by itself, tell you why visitors left or whether the page is performing poorly.
A high exit rate can result from slow loading speeds, confusing navigation, poor mobile UX, irrelevant content, intrusive pop-ups, or visitors simply finding the information they needed.
Why is my website exit rate so high?
Your website exit rate may be high because visitors are experiencing friction or because the page naturally ends their journey. Common factors include slow page speed, confusing navigation, poor mobile experiences, content that doesn't match search intent, intrusive pop-ups, and unclear calls to action.
Before making changes, consider the purpose of the page and whether visitors are leaving before or after completing the action you want them to take.
Why are visitors leaving my website without taking action?
Visitors may leave without taking action when they don't immediately find what they're looking for, don't understand the value of your offer, encounter a frustrating user experience, or aren't given a clear next step.
Review the page's content, messaging, calls to action, navigation, loading speed, mobile experience, and traffic source. Comparing these factors with engagement and conversion data can help identify where visitors are dropping off.
Does website exit rate affect SEO?
Website exit rate is not a direct Google ranking factor. Google does not use a page's exit-rate percentage as a standalone signal to determine search rankings.
However, the factors that contribute to a high exit rate, such as poor page experience, slow loading, irrelevant content, or difficult navigation, can affect how useful and accessible a website is to visitors. Improving those underlying issues can support a better overall website experience and broader SEO efforts.


%20-%20Text%20%26%20Icon%20-%20White%20(PNG)_edited.png)
Comments