
Average Website Session Duration by Industry (Benchmarks)

How long do visitors actually stay on your website after they arrive?
If you've ever opened Google Analytics and wondered whether your average website session duration is good, you're not alone.
Session duration can provide valuable insight into how visitors interact with your website, but knowing what the number actually means, and what you should compare it against, is where things get more complicated.
The average session duration for websites can vary significantly depending on the industry, business model, traffic source, search intent, and type of website.
A visitor researching financial services may need several minutes to evaluate their options, while someone looking for a local contractor's phone number may find exactly what they need in less than a minute.
That makes a single industry-wide number difficult to use as a universal target. Instead, an average website session duration benchmark should be used as a reference point that helps you identify potential opportunities and understand how your website compares with similar businesses.

In this guide, we'll break down average website session duration by industry, explain why visitor behaviour differs between industries, examine the factors that influence engagement, and show you how to improve your website's performance.
We'll also look at how to interpret session duration alongside other metrics so you can determine whether visitors are simply spending more time on your website, or actually engaging with your business.
If you're new to analytics, our Beginner's Guide to Google Analytics is a useful starting point for understanding the data behind your website's performance.
You can also explore Top Digital Marketing Metrics to Track to see how session duration fits into a broader digital marketing measurement strategy.

Average Website Session Duration by Industry
There is no single average website session duration that makes sense for every business. Visitor behaviour changes significantly depending on the industry, customer journey, purchase complexity, and type of information a visitor needs before taking action.
To provide a useful starting point, the following benchmarks are based on industry-level data published by First Page Sage. Their research reports that high-conversion websites maintain an average session duration of approximately 3 minutes and 36 seconds.
These figures should be treated as directional benchmarks rather than universal performance standards. Your website's ideal engagement level can vary considerably based on your audience, traffic sources, geographic market, website type, and conversion goals.
Industry | Average Website Session Duration |
Automobile | 2:41 |
B2B & SaaS | 4:26 |
Business Insurance | 4:06 |
Construction | 3:18 |
Contractors | 2:31 |
E-Commerce | 2:03 |
Energy | 2:53 |
Engineering | 3:00 |
Financial Services | 4:56 |
Healthcare | 2:58 |
Hotels & Hospitality | 2:35 |
HVAC | 2:56 |
IT Services | 4:16 |
Legal Services | 3:07 |
Manufacturing | 3:37 |
Real Estate | 3:52 |
Recruitment Services | 3:48 |
Average Website Session Duration by Industry Source: https://firstpagesage.com/reports/average-session-duration-by-industry/
These numbers provide valuable context when evaluating the average time on website by industry. However, they should not be interpreted as targets that every business needs to reach.
For example, a financial services website may naturally require more research than a local HVAC company. An ecommerce visitor may browse several products before purchasing, while a contractor's customer may simply confirm the service area and call for a quote.
The more important question is whether your website gives visitors enough information to confidently complete the action they came to take.

What Is a Good Average Session Duration?
There is no universal answer to what is a good average session duration.
The benchmark data provides a useful reference point, but your website's ideal performance depends on what visitors are trying to accomplish.
If your average session duration is below your industry's benchmark, that does not automatically mean your website has a problem. Likewise, exceeding the benchmark does not automatically mean your website is performing well.
A better approach is to ask whether visitors are engaging with important pages, completing desired actions, and converting into leads or customers.
For example, an HVAC company with a 90-second average session duration and a strong lead conversion rate may be outperforming a competitor with a five-minute average session and very few inquiries.
The benchmark is a starting point for investigation, not the finish line.
Ultimately, the strongest website performance strategy connects engagement metrics with business outcomes. Session duration can tell you something about visitor behaviour, but conversions, qualified leads, sales, and revenue tell you whether that behaviour is actually helping the business grow.
Average Session Duration Breakdown by Industry
The average session duration by industry varies significantly because visitors have different reasons for visiting a website.
A customer looking for an emergency HVAC repair may need only a few minutes to find a phone number, while a B2B buyer could spend several minutes comparing services, reviewing case studies, and researching a potential provider.
Rather than analyzing every industry, it is more useful to focus on several categories that demonstrate how customer intent affects website engagement.
The biggest takeaway from these benchmarks is that average session duration by industry is heavily influenced by customer intent.
Research-heavy industries such as financial services, B2B, IT, and manufacturing naturally provide more opportunities for extended website engagement.
Meanwhile, industries such as HVAC, contractors, and e-commerce can have shorter sessions because visitors may have highly specific or transactional goals.
Therefore, there is no universal answer to what the average session duration is on a website.
B2B & SaaS — 4 Minutes 26 Seconds
B2B and SaaS websites have one of the longer benchmarks, with an average session duration of 4:26.
The longer engagement makes sense because B2B purchases typically involve significant research. Visitors may explore multiple service pages, compare features, review case studies, investigate pricing, and evaluate whether the provider is a good fit.
For businesses targeting B2B customers, a longer session can be a positive sign when visitors are engaging with high-value content and moving toward actions such as requesting a consultation, booking a demo, or submitting an inquiry.
The key is to build a website that supports this research journey rather than simply trying to increase time on site.
Financial Services — 4 Minutes 56 Seconds
Financial services has the highest benchmark in the dataset at 4:56.
This is understandable because financial decisions often require significant consideration. Visitors may spend time researching investment services, insurance, financial planning, lending, or other specialized offerings before contacting a provider.
For financial businesses, detailed educational content can help increase meaningful engagement. Service explanations, FAQs, calculators, guides, and trust signals can give visitors the information they need to move closer to a decision.
However, a five-minute session is only valuable if the visitor is progressing toward a meaningful action, such as booking a consultation or submitting an inquiry.
IT Services — 4 Minutes 16 Seconds
IT services also has a relatively high benchmark at 4:16.
IT solutions can be difficult for potential customers to evaluate quickly. A business may need to understand managed IT, cybersecurity, cloud services, infrastructure, software, or technical support before deciding which provider to contact.
This makes detailed service pages and case studies particularly important.
A strong IT website should help visitors move naturally from understanding a problem to evaluating the solution and ultimately taking the next step.
Real Estate — 3 Minutes 52 Seconds
Real estate websites average approximately 3:52, reflecting the naturally research-heavy nature of property searches.
Visitors may browse listings, compare properties, view photos, research neighbourhoods, and investigate pricing before contacting an agent.
Real estate websites can therefore benefit from features that encourage useful exploration, such as property search, filters, related listings, neighbourhood information, and detailed property pages.
In this industry, longer sessions can be a natural part of the buying journey, but businesses should still measure whether engagement leads to inquiries, showing requests, calls, or other conversions.
Recruitment Services — 3 Minutes 48 Seconds
Recruitment services average approximately 3:48.
Recruitment websites typically serve two distinct audiences: employers looking for talent and candidates looking for opportunities. Both audiences may need to explore multiple pages before taking action.
A candidate might research available positions and the recruitment process, while an employer may review services, industries, expertise, and previous results.
This makes clear website navigation particularly important. Visitors should immediately understand which path is relevant to them and be able to move toward the appropriate conversion point.
Manufacturing — 3 Minutes 37 Seconds
Manufacturing websites have an average session duration of approximately 3:37.
Manufacturing buyers often need more technical information before contacting a company. They may research capabilities, production processes, certifications, materials, industries served, and previous projects.
As a result, manufacturing websites can naturally generate longer sessions when they provide detailed technical information and supporting content.
Case studies, project pages, product information, and technical resources can all help prospective buyers evaluate a company's capabilities.
Legal Services — 3 Minutes 7 Seconds
Legal services average approximately 3:07.
Legal visitors often have a specific problem they are trying to solve, but they may still need to evaluate a firm's practice areas, experience, reputation, and approach before making contact.
The strongest legal websites make it easy for visitors to determine whether the firm handles their particular situation.
Service-specific pages, attorney information, testimonials, FAQs, and educational resources can help visitors build confidence while creating natural pathways toward consultation requests.
Construction — 3 Minutes 18 Seconds
Construction websites average approximately 3:18.
Potential customers often want to see evidence that a contractor can successfully complete the type of project they are considering.
That makes project portfolios, case studies, service pages, testimonials, and information about geographic coverage especially valuable.
A visitor who spends several minutes reviewing completed projects and then submits a quote request represents much more valuable engagement than someone who spends five minutes passively browsing.
E-Commerce — 2 Minutes 3 Seconds
E-commerce has one of the shortest benchmarks in the dataset at approximately 2:03.
This is an important example of why businesses should not automatically assume that longer sessions are better.
Online shoppers can move quickly. They may arrive on a product page, check the price, review specifications, add the item to their cart, and complete the purchase within a relatively short session.
For e-commerce businesses, average session duration should therefore be evaluated alongside product views, add-to-cart activity, checkout progression, conversion rate, and revenue.
A two-minute session that produces a purchase can be significantly more valuable than a ten-minute session that produces nothing.
Contractors & HVAC — Approximately 2.5–3 Minutes
Contractor and HVAC websites tend to have shorter sessions, with contractors averaging 2:31 and HVAC approximately 2:56.
This is largely driven by high-intent searches.
Someone searching for an HVAC company may already know exactly what they need. They may simply want to confirm that the company provides the required service, operates in their area, has good reviews, and can be contacted quickly.
For these businesses, what is a good average session duration cannot be answered without considering conversions.
If a visitor spends two minutes on a website and immediately calls for an estimate, that may represent excellent performance.

What Is Website Session Duration?
Website session duration is one of the most useful metrics for understanding how visitors interact with your website. It helps answer a simple but important question: How much time are people actually spending on your website after they arrive?
However, session duration should never be viewed in isolation. A visitor who spends 45 seconds finding your phone number and calling your business may be more valuable than someone who spends five minutes browsing without taking any meaningful action.
That is why understanding session duration requires more than looking for a single “good” number. You need to understand how the metric is calculated, how it differs from other engagement metrics, and how visitor behaviour changes across industries.
What Is a Website Session?
A website session is a period of interaction between a visitor and your website. In simple terms, it represents a visit to your website, beginning when someone arrives and continuing while they interact with your site.
For example, someone might find your website through Google, visit your homepage, read your services page, view a case study, and then submit a contact form. Those interactions can occur within a single session.
A visitor can also have multiple sessions. Someone might visit your website today to research your services, return next week after receiving an email, and then come back later to make a purchase. Each visit can be recorded as a separate session.
This distinction matters because average session duration on a website describes the average length of these visits across a group of sessions. It does not mean that every individual visitor spends exactly that amount of time on the site.
It is also important to understand that analytics platforms have specific rules for determining when sessions begin, end, and how their duration is calculated. This means session-duration figures should always be interpreted according to the analytics platform being used.
What Is Average Session Duration?
Average website session duration is the average amount of time visitors spend during their recorded website sessions.
At a high level, the metric helps businesses understand whether visitors are spending very little time on their website or engaging with it for longer periods.
For example, imagine a website receives 1,000 sessions during a month. If those sessions collectively represent a certain amount of measured visit time, the analytics platform can calculate an average across those visits.
This is where website session duration benchmarks become useful. Comparing your performance with relevant businesses can help you determine whether your website's engagement appears unusually low, typical, or strong.
However, there is no universal average session duration by industry that applies to every business. A restaurant, law firm, e-commerce store, and B2B engineering company have completely different customer journeys.
A restaurant visitor may only need 30 seconds to check today's hours and call for a reservation. A potential engineering client may spend 10 minutes reviewing services, projects, technical capabilities, and company information before requesting a consultation.
Neither visitor behaviour is inherently better simply because one session lasted longer.
This is why average session duration should be treated as a directional performance indicator rather than a target that every website should maximize.

How to Calculate Average Website Session Duration
The basic concept behind calculating session duration is straightforward:
Total measured session time ÷ number of sessions = average session duration
If a group of sessions collectively represents 500 minutes of measured session time across 250 sessions, the resulting average would be 2 minutes per session.
However, real-world analytics platforms are more complicated than this simple equation suggests. The way session duration is recorded can depend on how interactions, timestamps, events, and sessions are processed by the platform.
That is particularly important when comparing historical Universal Analytics data with modern Google Analytics 4 data.
If you're researching the average time on website by industry, make sure the source is measuring the same metric using a comparable methodology. Otherwise, you could end up comparing fundamentally different measurements.
The same principle applies when researching an average website visit duration from different studies. Before treating a benchmark as meaningful, look at the platform, date range, industry definition, traffic sources, geography, and methodology behind the number.
To measure website session duration, start with your analytics platform and establish a baseline for your own website. Then segment that data by traffic source, device, landing page, and audience where possible.
This gives you a much more useful picture than relying on one website-wide average.
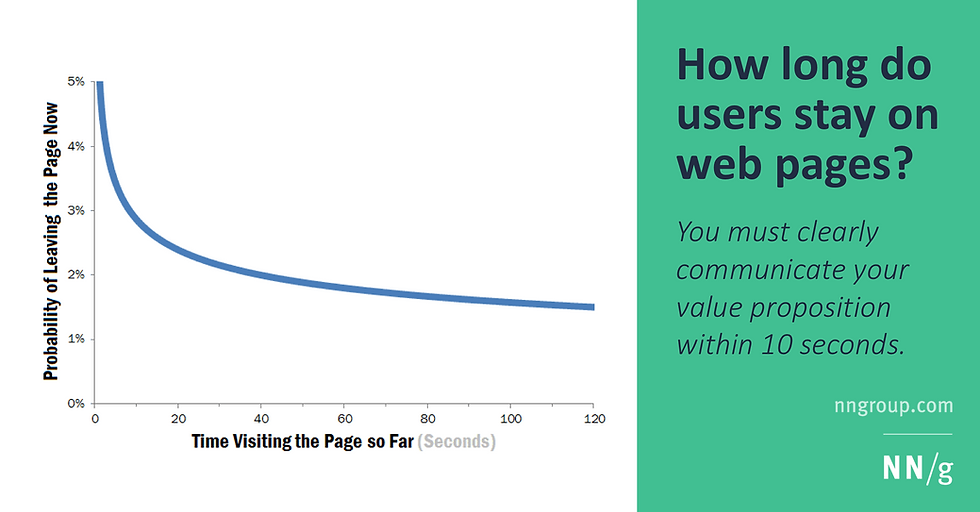
How Long Are Visitors Actually Staying on Your Website?
The answer depends heavily on what your visitors are trying to accomplish.
Someone searching “restaurant hours near me” may arrive, find the information they need, and leave within seconds. If that visitor then walks into the restaurant, makes a reservation, or calls, the short session may represent a successful customer journey.
On the other hand, someone searching for an accounting firm may need to compare services, review credentials, read testimonials, and understand pricing before contacting a company. A longer session may therefore be expected.
This is why average time on site by industry should be interpreted alongside search intent and conversion behaviour.
A high average website visit duration can indicate that visitors are engaging with your content, exploring multiple pages, or researching your products and services. But it can also indicate that visitors are struggling to find what they need.
Likewise, a low session duration could indicate poor content, slow loading times, confusing navigation, or irrelevant traffic. But it could also mean visitors are finding the information they need quickly.

Average Session Duration vs Time on Page
Average website session time and time on page are related concepts, but they measure different aspects of visitor behaviour.
Session duration looks at the visit as a whole. Time on page focuses on the amount of time associated with a particular page during a user's visit.
A visitor could arrive on a service page, spend several minutes researching the offering, navigate to a case study, and then visit the contact page. Looking only at the overall session can tell you that the visitor had an extended visit, while page-level metrics can help reveal where that engagement occurred.
This distinction becomes particularly useful when analyzing an average session time by industry.
A business might discover that its overall session duration looks healthy, but visitors are spending very little time on its most important service pages. That could indicate an opportunity to improve the content, messaging, design, or calls-to-action on those pages.
Conversely, a long time spent on a page isn't automatically positive. If visitors spend several minutes trying to understand confusing pricing information or struggling to find a contact option, the extra time could indicate friction rather than engagement.

Where to Find Average Website Session Duration in Google Analytics
For businesses using Google Analytics 4, it's important to understand that the platform has moved away from relying on traditional session-duration reporting as the primary measure of engagement.
GA4 places greater emphasis on engagement time and engagement rate. This reflects a broader shift toward measuring meaningful interactions rather than simply measuring how long a session remains open.
If you're looking for average session time in Google Analytics, the exact report or metric you use will therefore depend on whether you're working with historical Universal Analytics data or a current GA4 property.
For a detailed walkthrough of Google's analytics platform, see our Beginner's Guide to Google Analytics. It can help you understand where your engagement, traffic, acquisition, and conversion data fits within your overall website performance strategy.
The key takeaway is that analytics metrics should be interpreted in context. A number by itself rarely tells the complete story.
Factors That Influence Average Website Session Duration
Your website average session duration is influenced by much more than the quality of your content. Visitor intent, website design, navigation, page speed, and the relevance of your information can all determine whether someone quickly finds what they need or continues exploring.
This is why businesses should be cautious about treating session duration as a standalone KPI. A longer session is not automatically better, and a shorter session is not necessarily a sign of poor performance.
The more useful question is what a good session duration is for your specific audience, industry, and conversion journey, and whether visitors are completing the actions that matter to your business.

Industry and Search Intent
One of the biggest influences on average website session duration is why someone visited your website in the first place.
A visitor searching for “emergency plumber near me” has very different intent from someone searching for “how much does a commercial plumbing system cost?” The first person may want a phone number immediately, while the second may spend several minutes researching.
This is why average website visit duration can vary substantially even between businesses offering similar services.
Search intent can generally range from informational research to commercial investigation and transactional action. The further a visitor is from making a decision, the more time they may spend consuming information.
Someone researching accounting services may read service pages, compare credentials, review testimonials, and explore pricing before contacting a firm. A visitor searching for a business's phone number may leave almost immediately after finding it.
A strong website therefore doesn't attempt to keep every visitor on the site for as long as possible. Instead, it provides the right information for the visitor's intent and makes the next step easy.

Website Design
Website design has a direct impact on how easily visitors can understand and interact with your website.
A visually attractive website can create a strong first impression, but good design goes much further than aesthetics. Layout, typography, spacing, imagery, calls-to-action, content hierarchy, and responsive behaviour all influence how visitors move through a page.
This can have a significant effect on average session duration on a website.
If a visitor lands on a cluttered page with unclear messaging, they may leave before exploring anything else. Conversely, a well-structured page can encourage visitors to continue reading, explore related services, and move deeper into the website.
This is particularly important for businesses selling complex services. When the design makes complicated information easier to understand, visitors have fewer reasons to abandon the page.
Learn more about this relationship in How Website Design Affects User Experience, which explores how design decisions influence usability, engagement, and conversions.
Businesses can also use How to Choose the Best Website Design to better understand how to select a website structure and visual approach that fits their audience and goals.
Ultimately, the goal isn't to create a website where visitors spend the maximum amount of time. It's to create a website where visitors can quickly understand the business, confidently evaluate the offering, and take the next step.

Content Quality
Content is another major factor influencing website session duration benchmarks.
When visitors find useful, relevant, and easy-to-understand information, they have a reason to continue exploring the website. When content is vague, repetitive, or doesn't answer their questions, there is little reason to stay.
High-quality content should address the questions that prospective customers actually have.
For a roofing company, that might include service information, project examples, materials, warranties, financing, service areas, and common roofing problems. For a SaaS company, it could include product features, integrations, use cases, pricing, documentation, and customer success stories.
This also explains why website engagement benchmarks can differ dramatically between industries.
A content-heavy B2B website may naturally generate longer sessions because visitors need more information to make a decision. A local service business may have shorter sessions because customers are primarily looking for a service, phone number, location, or quote.

Website Navigation
Even excellent content can underperform if visitors cannot find it.
Website navigation determines how easily someone can move from one page to another and discover information relevant to their needs.
Poor navigation creates friction. Visitors may know that the information they need exists somewhere on the website but have no idea where to find it. When that happens, leaving the website and returning to Google is often easier.
Clear navigation can increase average website engagement time by creating logical pathways between related pages.
A visitor reading a construction company's commercial construction page could be directed toward relevant project examples, service areas, FAQs, and a consultation page. Each link provides a natural next step rather than forcing the visitor to return to the main menu.
The same principle applies to e-commerce, professional services, healthcare, and virtually every other industry.
Your goal should be to create a navigation system that answers a visitor's next question before they have to ask it.
For more practical recommendations, see our Website Navigation Best Practices.
When analyzing average user session duration, also look beyond the overall number. Examine which pages visitors enter through, where they go next, and where they commonly leave.

Page Speed
Website performance can have a major influence on visitor behaviour.
When pages load slowly, visitors are forced to wait before they can see the information they came for. That delay can increase abandonment and reduce the likelihood that someone explores additional pages.
This means page speed can indirectly influence average session time and average session duration.
Consider two otherwise identical websites. If the first loads quickly and the second takes several seconds longer to display important content, visitors on the slower website have more opportunities to leave before engaging.
Page speed becomes especially important on mobile devices, where users may be dealing with slower connections, smaller screens, or less reliable network conditions.
Businesses should therefore monitor both overall website performance and the experience of important landing pages.
For a deeper look at performance benchmarks, see our complete guide on the Average Website Page Speed.
It's also important to remember that speed should be considered alongside usability. A fast website with confusing navigation and weak content will not necessarily create strong engagement.
The strongest websites combine fast performance, clear design, useful content, intuitive navigation, and strong conversion paths.
How to Increase Average Website Session Duration
Increasing your average website session duration shouldn't mean trying to keep visitors on your website for as long as possible. The goal is to create an experience that naturally encourages qualified visitors to explore more of your website, consume useful information, and move toward conversion.
Before making changes, establish your current baseline in Google Analytics. Looking at Google Analytics session duration alongside engagement rate, landing pages, traffic sources, and conversions can help you identify where visitors are leaving and which pages are generating meaningful engagement.
You can then compare your performance with the average website session duration by industry to establish a directional benchmark.
Remember that what is a good average session duration depends on your business model. A visitor who spends 90 seconds finding a phone number and calling your company may be more valuable than someone who spends 10 minutes browsing without taking action.
Improve Website Navigation
Clear navigation gives visitors a reason to continue exploring your website.
If someone lands on a service page, for example, they should be able to easily discover related services, case studies, FAQs, service areas, or a contact page without having to return to Google.
This can help increase average session duration by industry by creating logical pathways between related pages.
Review your main navigation, footer links, dropdowns, and contextual links to make sure important information is easy to discover. Avoid overwhelming visitors with dozens of options. Instead, organize pages according to how your customers actually think about your products and services.
Improve Content Quality
Visitors stay longer when your website gives them a reason to keep reading.
If a service page provides only a short description of what you do, visitors may have to leave the website to find answers to their questions. A stronger page anticipates those questions and provides useful information directly within the customer journey.
Improving your average website session duration can therefore start with improving the quality and usefulness of your most important pages.
Instead of adding content simply to make pages longer, focus on making them more helpful. Explain your services clearly, address common objections, demonstrate expertise, provide examples, and show visitors what they should do next.
For example, a construction company could connect a service page with relevant project examples, FAQs, financing information, and a consultation CTA. Each element gives visitors another reason to continue exploring.
The best content doesn't simply increase time on a page. It reduces uncertainty and moves visitors closer to a decision.

Incorporate Internal Linking
Internal links are one of the simplest ways to encourage visitors to discover more relevant content.
Suppose someone reads a page about local SEO. Rather than ending the visitor's journey there, you could link to a related guide about keyword research, Google Business Profile optimization, or technical SEO.
This creates a natural path through your website and can increase average session duration on a website by encouraging additional page views.
Internal linking also helps search engines understand the relationship between different pages on your website. A strategically structured internal linking system can therefore support both user experience and SEO.
When analyzing average session duration, pay attention to whether visitors who view multiple pages are also more likely to convert. If they are, creating more logical internal pathways may have a direct business benefit.
For a deeper look at how internal links contribute to organic visibility and website structure, explore our Beginner's Guide to SEO.

Improve Mobile UX
Mobile visitors should be able to navigate, read, and interact with your website just as easily as desktop users.
A website that looks excellent on a large monitor can become difficult to use on a smartphone if text is too small, buttons are difficult to tap, menus are cumbersome, or important information is pushed too far down the page.
This can negatively affect Google Analytics average session duration, particularly if a significant portion of your traffic comes from mobile devices.
Start by comparing engagement between mobile and desktop visitors in your analytics platform. If mobile users consistently show substantially weaker engagement or conversion behaviour, investigate the mobile experience rather than assuming the traffic itself is the problem.
Pay particular attention to navigation, page speed, readability, forms, buttons, images, and sticky elements.
Your goal should be to make the mobile journey feel intentional rather than like a smaller version of the desktop website.
Conclusion
Understanding your average website session duration can provide valuable insight into how visitors interact with your website, but it should never be treated as a standalone measure of success.
A longer session isn't automatically better. What matters is whether visitors are finding the information they need, exploring relevant pages, building trust, and ultimately taking meaningful actions such as submitting a form, calling your business, booking an appointment, or making a purchase.
The GA4 session duration metric can help you identify engagement patterns, but it's most useful when analyzed alongside other metrics such as engagement rate, conversions, traffic sources, and landing-page performance.
If you're new to GA4, our Beginner's Guide to Google Analytics can help you understand how to navigate your analytics data and identify the metrics that matter most for your business.
It's also important to compare your performance against an Average session duration benchmark by industry without treating the benchmark as a fixed target. Different industries have different customer journeys, search intents, and information requirements.
For example, a B2B company may naturally require longer sessions because customers need to research complex services, while a local contractor may generate a valuable lead from a much shorter visit.
Ultimately, the best website is not necessarily the one that keeps visitors online the longest. It's the one that turns visitor attention into meaningful business results.
Use your average session duration in Google Analytics to understand what visitors are doing, identify opportunities to improve your website experience, and then connect those insights to the metrics that directly support growth.
For a broader view of website and digital marketing performance, explore our Top Digital Marketing Metrics to Track and start evaluating engagement as part of a complete measurement strategy, not in isolation.
Frequently Asked Questions (FAQ)
What is an average session duration?
Average session duration is a measurement of how much time visitors typically spend during a website session. It can help businesses understand how engaged visitors are, but it should be evaluated alongside engagement, conversions, pages viewed, and traffic source rather than used as a standalone performance metric.
What is the average session duration by industry?
Average session duration varies considerably by industry because visitor intent and customer journeys are different. For example, research-heavy industries such as financial services and B2B can naturally have longer sessions, while local service and ecommerce websites may have shorter sessions. Industry benchmarks should be treated as directional reference points rather than universal targets.
What is the average duration of a website session?
There is no single average duration that applies to every website. The appropriate benchmark depends on factors such as industry, website type, traffic source, content quality, and the complexity of the customer's buying journey. Comparing your website with businesses in the same industry provides more useful context than relying on a universal average.
What is a good average engagement time on a website?
A good engagement time depends on what visitors are expected to accomplish. A visitor who spends one minute reading a service page and then submits a lead form may represent stronger performance than someone who spends five minutes browsing without converting. The best benchmark is one that combines engagement with meaningful business outcomes.
How long does a session typically last in Google Analytics?
Session length varies from website to website. In Google Analytics 4, businesses should pay particular attention to engagement-focused metrics rather than assuming that a longer session is always better. Factors such as visitor activity, page interactions, traffic source, and whether the visitor completes a conversion all affect how session data should be interpreted.
What is session time?
Session time refers to the amount of time associated with a visitor's session on a website. It is intended to provide insight into how long visitors interact with the site during a visit. However, the way session duration is calculated can differ between analytics platforms, so businesses should understand the specific metric they are using.
What is the average time on a website?
Average time on a website varies by industry, audience, and visitor intent. Research-heavy websites can naturally generate longer visits, while transactional websites may have shorter sessions because visitors can quickly find what they need. Rather than targeting a specific number, businesses should focus on whether visitors are engaging with important content and taking desired actions.
What is considered a session in Google Analytics?
A session is a period of interaction between a visitor and your website. During a session, a user can view pages, interact with content, and complete events such as form submissions or purchases. Google Analytics 4 uses its own session definitions and reporting methodology, so businesses should use GA4's current documentation and metrics when analyzing session data.
How to find website sessions on Google Analytics?
In Google Analytics 4, you can find session-related data through the Reports section and relevant acquisition, engagement, or user reports. Look for metrics such as Sessions, Engaged sessions, and Average engagement time to understand both the volume and quality of website visits.


%20-%20Text%20%26%20Icon%20-%20White%20(PNG)_edited.png)
Comments