
Average Website Bounce Rate by Industry (2026 Benchmarks)
- Vladyslav Bendasyuk

- May 15
- 19 min read
If you’ve ever looked at your website analytics and wondered whether your performance is “good” or “bad,” you’re not alone.
One of the most common questions businesses ask is how their numbers compare to others, and more specifically, how their average website bounce rate by industry stacks up against real benchmarks.
Without context, bounce rate can feel like a confusing metric. Is a high number a problem? Is a low number always better? And what does it actually say about your website’s effectiveness?
The reality is that bounce rate is one of the most misunderstood metrics in digital marketing.
Many businesses see a high bounce rate and assume something is broken, while others ignore it entirely.
In truth, the answer lies somewhere in between. To properly evaluate performance, you need to understand how your data compares to a bounce rate by industry benchmark, not just a generic average.
A major issue is that businesses often look at their analytics in isolation.
They might search for the average bounce rate by industry or try to find a universal number that defines success. But without understanding user intent, traffic sources, and website structure, those numbers can be misleading.
For example, a blog post with a high bounce rate may actually be performing well if users are finding exactly what they need. On the other hand, a service page with the same bounce rate could indicate lost opportunities and poor engagement.

This is why analyzing the average website bounce rate by industry is essential, it provides the context needed to make informed decisions rather than assumptions.
In this guide, we break down everything you need to know about bounce rate from both a strategic and practical perspective.
You’ll learn how to interpret average bounce rate by industry data, what benchmarks actually mean for your business, and how to identify whether your website is underperforming or aligned with expectations.
If you want to understand how bounce rate fits into your overall marketing performance, we also recommend exploring our guide on Top Digital Marketing Metrics to Track, where we break down the key KPIs that truly impact growth.
If you are looking for a step-by-step framework to build and scale your online presence, you can start with our Free E-Book on How to Build Your Business's Online Presence (In 90 Days).

What Is Bounce Rate?
Understanding what bounce rate is is foundational for evaluating how effectively your website is performing in attracting and retaining visitors.
At its core, bounce rate measures the percentage of users who land on a webpage and leave without taking any further action, such as clicking another page, filling out a form, or engaging with content.
From a technical perspective, a “bounce” is not necessarily a negative signal in every scenario. It simply reflects a single-page session.
However, in digital marketing, it often becomes a critical indicator of whether your website is successfully guiding users deeper into your content or funnel.
When we talk about average website bounce rate by industry, it becomes clear that context matters significantly.
A blog post, for example, naturally has a higher bounce rate compared to a service-based landing page or an eCommerce product page.
This is why relying on a universal number without industry context can lead to misleading conclusions about performance.
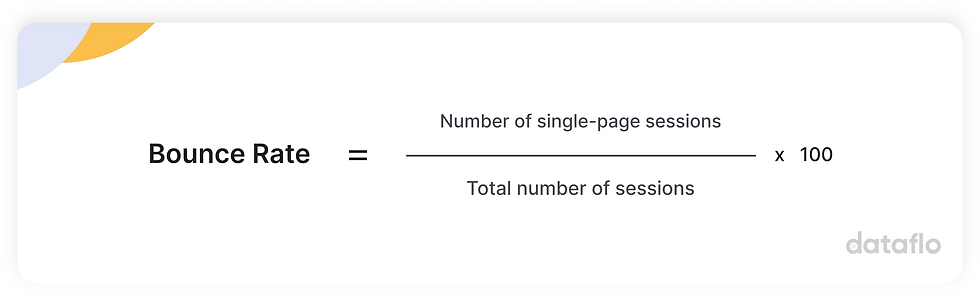
How Bounce Rate Is Calculated
Bounce rate is calculated by dividing single-page sessions by total sessions on a page or website, then multiplying by 100 to get a percentage.
In practical terms, if 100 users visit your website and 60 leave without interacting further, your bounce rate is 60%.
However, with the shift to GA4 (Google Analytics 4), this metric has evolved. Google now emphasizes engagement-based tracking, which makes understanding website bounce rate benchmarks more important than ever when interpreting performance data.
Why Bounce Rate Matters on Websites and in Digital Marketing?
Bounce rate plays a critical role in understanding how effectively your website is performing as part of your broader digital marketing ecosystem.
It is not just a technical metric; it is a reflection of user experience, messaging clarity, and traffic quality.
When analyzing the average bounce rate for websites, it becomes clear that performance varies widely depending on industry and intent. This is why comparing your site against a normal website bounce rate is far more meaningful than looking at isolated numbers.
A high bounce rate often signals that users are not finding what they expected when they landed on your page.
This could be due to mismatched messaging between ads and landing pages, poor website structure, slow load times, or unclear calls-to-action.
Conversely, a well-optimized website with strong UX and aligned messaging tends to perform closer to a typical website bounce rate for its industry, indicating that users are engaging with content and moving deeper into the site.
From a marketing perspective, bounce rate also impacts how efficiently your traffic converts.
If users consistently leave without interaction, it increases acquisition costs and reduces return on investment across SEO, paid ads, and social campaigns.
Improving bounce rate is often one of the fastest ways to improve overall digital performance without increasing ad spend.

Bounce Rate vs Exit Rate (Common Confusion)
One of the most misunderstood concepts in analytics is the difference between bounce rate and exit rate.
While they may appear similar, they measure two very different behaviours, and confusing them can lead to incorrect optimization decisions.
Bounce rate focuses on single-page sessions, users who enter and leave without interacting further. Exit rate, on the other hand, measures the percentage of users who leave your website from a specific page, regardless of how many pages they visited beforehand.
Understanding this distinction is essential when evaluating website engagement metrics benchmarks, because each metric provides different insights into user behaviour.
When combined with website engagement metrics benchmarks, bounce rate becomes part of a larger performance ecosystem rather than an isolated KPI.

Source: CXL
Average Website Bounce Rate by Industry
When analyzing website performance, one of the most important realities to understand is that bounce rate is not universal.
A “good” or “bad” bounce rate depends heavily on context, especially the type of industry, user intent, and how visitors typically interact with your content.
This is where the average website bounce rate by industry becomes a critical benchmark. Instead of judging performance in isolation, businesses need to compare their data against realistic expectations based on how users behave within their specific sector.
Below is a general benchmark overview based on aggregated industry behaviour patterns. These ranges help provide clarity when comparing your website against realistic expectations.
Industry | Average Bounce Rate (%) |
Food & drink | 65.52% |
Science | 62.24% |
Reference | 59.57% |
People & society | 58.75% |
Pet & animals | 57.93% |
News | 56.52% |
Arts & entertainment | 56.04% |
Books & literature | 55.86% |
Beauty & fitness | 55.73% |
Home & garden | 55.06% |
Computers & electronics | 55.54% |
Hobbies & leisure | 54.05% |
Internet | 53.59% |
Autos & Vehicles | 51.96% |
Finance | 51.71% |
Sports | 51.12% |
Travel | 50.65% |
Business & industrials | 50.59% |
Jobs & education | 49.34% |
Online communities | 46.98% |
Games | 46.70% |
Shopping | 45.68% |
Real estate | 44.50% |
Different industries attract different types of user intent, and that intent directly influences bounce behaviour.
For example, informational websites like blogs or educational resources often have higher bounce rates because users come for a single piece of content, consume it, and leave satisfied. There is no expectation for multi-page navigation.
In contrast, eCommerce and service-based websites are designed to guide users through multiple steps, browsing products, reviewing services, or submitting inquiries. As a result, engagement is deeper, and bounce rates are typically lower.
This difference is why relying solely on generic benchmarks can be misleading. A “high” bounce rate in one industry may actually be completely normal in another.
Industry Benchmark Overview Table
Rather than relying on a single universal metric, businesses should compare their analytics to realistic expectations based on their sector, audience behaviour, and traffic intent.
This is the foundation of accurate performance analysis and one of the most overlooked aspects of digital strategy.
When we look at the average site bounce rate across industries, the differences are significant enough to completely change how performance is interpreted. A number that may seem “high” in one industry can actually be completely normal in another.
That’s why the question of what is an average bounce rate for a website cannot be answered without context, it depends entirely on the type of website and how users are expected to interact with it.
Content-Heavy Industries Naturally Have Higher Bounce Rates
Industries such as Food & Drink, Science, Reference, and News consistently show some of the highest bounce rates in the dataset, often ranging from the mid-50s to mid-60s.
This is not necessarily a performance problem.
Instead, it reflects user intent.
Visitors in these industries are typically looking for quick, specific answers, such as a recipe, a fact, or a news update. Once they find it, they leave. That single interaction still represents success from a content delivery perspective.
In this context, a higher average bounce rate of a website is expected and does not automatically indicate poor engagement.
Lifestyle and Interest-Based Sites Sit in the Middle Range
Industries like Beauty & Fitness, Home & Garden, Hobbies & Leisure, and Arts & Entertainment generally fall into a mid-range bounce rate zone, typically in the mid-50% range.
These industries reflect more exploratory user behaviour.
Users often browse multiple pages, compare options, or consume content in a more relaxed way. However, they are not always ready to convert immediately.
This creates a balanced engagement profile where the average bounce rate by industry reflects both curiosity and partial intent, rather than direct purchase behaviour.
For these websites, improving internal linking and content pathways can significantly enhance engagement without necessarily reducing bounce rate aggressively.
Transactional Industries Show Stronger Engagement Patterns
Industries like Real Estate, Shopping, Jobs & Education, and Online Communities consistently show some of the lowest bounce rates, often below 50%.
This is because user intent in these sectors is much more action-driven.
Visitors are actively comparing listings, evaluating opportunities, or navigating structured platforms. As a result, they naturally interact with multiple pages.
In these cases, what is an average bounce rate for a website becomes less about a number and more about journey depth. A lower bounce rate typically signals strong UX, clear navigation, and effective conversion pathways.
Across all industries, the most successful websites are not necessarily those with the lowest bounce rates; they are the ones that align user behaviour with intent.

Source: MobiLoud
E-commerce Bounce Rate Benchmarks
When evaluating performance in online retail, bounce rate becomes one of the most important indicators of whether your store is successfully capturing and retaining buyer intent.
Unlike informational websites, e-commerce platforms are designed to guide users through exploration, comparison, and ultimately conversion.
In most cases, the average e-commerce bounce rate sits between 42% – 48%, making it one of the most engaged website categories across all industries.
This range is widely recognized as a strong benchmark when analyzing website bounce rate by industry, especially for transactional digital environments.
If your e-commerce website is operating within this range, it generally indicates that users are engaging with your product pages, browsing collections, and moving deeper into the shopping experience.
However, it is important to understand that “good” is not a fixed number.
Traffic source quality plays a major role. Users arriving from high-intent search queries or branded campaigns tend to engage more deeply, resulting in lower bounce rates.
On the other hand, cold traffic from display ads or social media may result in higher initial bounce rates due to lower purchase intent.
Product type also matters significantly. High-consideration products such as electronics, furniture, or luxury goods often see more browsing behaviour, which can reduce bounce rates naturally.
Conversely, low-cost or impulse-buy products may result in quicker decisions and different engagement patterns.
Another key factor is intent. Users landing on product pages often already have a transactional mindset.
In the broader context of website bounce rate by industry, e-commerce stands out not just because of its lower benchmark range, but because of how closely engagement is tied to revenue outcomes.
Landing Pages Bounce Rate Benchmarks
Landing pages are one of the most critical components in any digital marketing system because they are designed with a single purpose: conversion.
Unlike full websites that encourage exploration, landing pages are intentionally focused, which significantly impacts how users behave once they arrive.
When analyzing performance, the average landing page bounce rate is typically much higher than most people expect.
In fact, the average landing bounce rate commonly ranges between 60% and 90%, depending on traffic quality, offer clarity, and campaign alignment.
This makes landing pages one of the most misunderstood areas when evaluating average website bounce rate by industry, because their function is fundamentally different from traditional website pages.
The average bounce rate for landing page performance is naturally elevated because landing pages are designed for a very specific user journey.
Unlike a homepage or service page where users are encouraged to explore multiple sections, landing pages are built around a single action, such as filling out a form, downloading a resource, or making a purchase.
If a user does not immediately find value in the offer or message, they will often leave without interacting further. This behaviour increases bounce rate but does not always indicate poor performance.
In many cases, a high average landing page bounce rate simply reflects strong targeting efficiency. If the wrong audience is being sent to a highly specific offer, they will naturally exit quickly.
To understand how landing pages fit into a broader conversion system, you can explore our Beginner's Guide to Landing Pages, where we break down how to build pages that convert traffic into measurable growth.

Source: HubSpot
What Is a Good Bounce Rate?
One of the most common questions businesses ask is what a good bounce rate is, and the honest answer is that it depends on context.
However, as a general benchmark, the average bounce rate of a website sits around 47%, which provides a useful baseline for evaluating overall performance.
This number gives you a starting point, but it should never be treated as a universal target.
A “good” bounce rate is not just about being below average; it is about how well your website aligns with user intent, industry standards, and business goals.
Websites performing significantly below this range often demonstrate strong engagement, clear navigation, and effective content flow.
Users are moving beyond the first page, exploring additional content, and progressing through the funnel.
On the other hand, websites performing well above this average may be experiencing friction points.
General Benchmarks Across Websites
When businesses ask what a normal bounce rate is, they are usually looking for a simple number to measure performance against. While there is no one-size-fits-all answer, general benchmarks can provide a helpful starting point.
Across most industries, bounce rates tend to fall into three broad categories that indicate how users are interacting with a website.
A bounce rate between 20%–40% is typically considered strong.
This range suggests that users are engaging with multiple pages, exploring content, and moving deeper into the website experience.
A range between 40%–60% is generally seen as average and aligns closely with broader industry data.
For many businesses, this falls within what should be the ideal bounce rate for a website, especially when traffic quality and intent are properly aligned.
Anything above 60% may signal potential issues, but only when evaluated in the right context.
In some cases, particularly for blogs or informational pages, higher bounce rates are expected and do not necessarily indicate poor performance.
Why “Good Bounce Rate” Is Not Universal
One of the biggest misconceptions in digital marketing is assuming that a single number defines success. In reality, what is the average bounce rate of a website varies significantly depending on multiple factors.
While the overall what is the average website bounce rate often sits around the mid-40% range, this number is only meaningful when viewed in context.
Different industries naturally produce different user behaviours. A blog post designed to answer a specific question will almost always have a higher bounce rate than a product page designed to encourage browsing and purchasing.
User intent also plays a major role. Visitors who arrive with informational intent are more likely to leave after finding what they need. In contrast, users with transactional intent tend to explore multiple pages before making a decision.
Even traffic sources can dramatically influence bounce rate. Organic search traffic often behaves differently from paid ads or social media traffic, leading to variations in engagement patterns.
Because of these differences, defining a “good” bounce rate requires a deeper understanding of how users interact with your specific website, not just comparing numbers in isolation.

Key Factors That Influence Bounce Rate
Bounce rate is not random. It is a direct reflection of how users experience your website from the moment they land on a page.
For businesses looking to how to reduce website bounce rate, the most effective approach is to focus on the core factors that shape user behaviour.
Improving these areas not only helps improve website engagement rate but also creates a stronger foundation for conversions and long-term growth.

Page Speed
Page speed is one of the most immediate and impactful factors affecting bounce rate.
If a website takes too long to load, users often leave before they even see the content. Even a delay of a few seconds can significantly increase abandonment rates, especially on mobile devices.
To fix high bounce rate website issues related to speed, businesses should focus on optimizing images, improving hosting performance, and reducing unnecessary scripts.
Faster load times create a smoother experience and encourage users to stay longer.
UX Design
User experience (UX) design determines how easily visitors can navigate and interact with your website.
A cluttered layout, confusing navigation, or poor mobile responsiveness can quickly drive users away.
On the other hand, a clean, intuitive design encourages exploration and keeps users engaged.
Improving UX is one of the most effective ways to improve bounce rate, as it directly impacts how users move through your site and interact with your content.

Intent Match
Intent match refers to how well your page aligns with what the user expected when they clicked.
If someone searches for a specific solution and lands on a page that does not clearly address their needs, they will leave almost immediately. This is one of the most common causes of high bounce rates.
Ensuring that your headlines, content, and messaging match user intent is critical for reducing bounce rate and increasing engagement.
Content Quality
Content is often the deciding factor in whether a user stays or leaves.
High-quality content is clear, relevant, and immediately valuable. It answers the user’s question, provides insight, and encourages further interaction.
Poorly structured or generic content, on the other hand, creates friction and leads to quick exits.
Businesses aiming to improve website engagement rate should prioritize content that is easy to read, well-organized, and aligned with user needs.

CTA Clarity
Call-to-actions (CTAs) play a crucial role in guiding users toward the next step.
If a page lacks a clear direction, users are more likely to leave after consuming the initial content.
Strong CTAs provide a logical path forward, whether that is exploring another page, submitting a form, or making a purchase.
Clear and strategically placed CTAs are essential for businesses looking to fix high bounce rate website issues and improve overall performance.
How to Analyze Your Website Bounce Rate?
Understanding your bounce rate is one thing; knowing how to analyze it properly is where real performance improvements begin.
Many businesses look at a single number and try to draw conclusions, but that approach often leads to misinterpretation. To get meaningful insights, you need to break down your data and evaluate it against context, intent, and benchmarks.
For example, the average bounce rate for small business website performance will differ from large enterprise sites or high-traffic platforms.
Small business websites often rely on local traffic, limited content depth, and fewer entry points, which naturally affects engagement patterns.
The goal of analysis is not just to measure your bounce rate of the website, but to understand why users behave the way they do, and where improvements can drive growth.

Step 1: Access Google Analytics 4 (GA4)
The first step in analyzing your bounce rate is accessing your data through Google Analytics 4.
If you are new to the platform, we recommend reviewing our Beginner’s Guide to Google Analytics to understand how tracking and engagement metrics work in GA4.
Once inside GA4, you will notice that bounce rate is no longer the primary focus. Instead, Google emphasizes engagement rate. However, bounce rate still exists as a complementary metric and can be added to reports.
When reviewing the average bounce rate of website performance, it is important to remember that GA4 calculates engagement differently than previous versions.
This means your interpretation should focus on overall user interaction, not just single-page exits.

Step 2: Access Traffic Source Report
To begin analyzing behaviour, navigate to the reporting section within GA4.
Go to:
Reports
Lifecycle
Engagement
Pages and Screens
This section provides a detailed breakdown of how individual pages are performing, including user engagement, views, and session data.
Here, you can start identifying patterns in how users interact with your content and which pages may be contributing to higher bounce rates.
Rather than looking at your entire website as a whole, this page-level analysis gives you a clearer picture of where issues, and opportunities, exist.

Step 3: Customize Traffic Source Report to Include Bounce Rate
By default, GA4 focuses on engagement metrics, so you will need to customize your report to include bounce rate.
Add metrics such as bounce rate (%) or average engagement rate (%) to your report view. This allows you to directly compare engagement levels across different pages and traffic segments.
At this stage, it is important to understand what is a high bounce rate for a website in your specific context.
For example, a 70% bounce rate may be normal for a blog post but problematic for a service landing page. Without context, the number alone can be misleading.
Using this customized view, you can begin identifying which pages fall outside a good website bounce rate or acceptable bounce rate range based on their purpose.

Source: CXL
Step 4: Segment the Traffic By Traffic Sources
Once your data is visible, the next step is segmentation.
Break down your traffic by source, such as organic search, paid ads, direct traffic, and social media. Each source represents a different level of intent and engagement.
For example, organic traffic often reflects higher intent and may result in a lower bounce rate. Paid or social traffic, especially at the awareness stage, may show higher bounce rates due to lower initial intent.
Segmenting traffic allows you to understand whether your bounce rate is being influenced by traffic quality rather than website performance.
Step 5: Find High Bounce Rate Pages and Optimize Them
The final step is identifying pages with unusually high bounce rates and prioritizing them for optimization.
Start by comparing page performance against what is a normal website bounce rate for that type of content. Pages that significantly exceed this range are often where the biggest opportunities exist.
Look for patterns across these pages.
Are users leaving immediately due to slow load times?
Is the content not matching the user’s search intent?
Is there a lack of clear direction or next steps?
These insights will guide your optimization strategy.
Improving these pages may involve refining content structure, improving design, strengthening calls-to-action, or aligning messaging more closely with user expectations.
Conclusion
Understanding bounce rate is not about chasing a single number; it is about understanding user behaviour and aligning your website with real intent.
Throughout this guide, we’ve explored how the average website bounce rate by industry varies significantly depending on content type, user expectations, and digital strategy. From content-heavy websites with naturally higher bounce rates to transactional platforms with deeper engagement, the data makes one thing clear:
Context is everything.
The overall average website bounce rate, often sitting around the mid-40% range, provides a helpful baseline.
But asking what the average bounce rate for website performance is without considering industry, traffic source, and page purpose can lead to inaccurate conclusions.
Instead, the more strategic question is: How does your website perform relative to your industry benchmarks, and is it effectively guiding users toward meaningful action?
Knowing what the average bounce rate for a website is is only the first step. The real value comes from using that insight to improve performance.
When you analyze your data against the average bounce rate by industry benchmarks, you can begin to identify where your website is underperforming and where opportunities exist.
In many cases, improving bounce rate is not about reducing exits, it is about improving the experience.
Bounce rate is just one piece of a much larger performance ecosystem.
To truly scale your online presence, it is important to evaluate bounce rate alongside other key metrics such as conversion rate, traffic quality, and user engagement.
If you want to go deeper into how these metrics work together, explore our guide on Top Digital Marketing Metrics to Track and see how bounce rate fits into a broader growth strategy.
You can also compare your performance against real data in our Average Website Conversion Rate Benchmarks to better understand how engagement translates into results.
If you are looking to take control of your online presence and improve performance across the board, start with our Free E-Book on How to Build Your Business's Online Presence (In 90 Days).
Frequently Asked Questions (FAQs)
What is a healthy bounce rate for a website?
A healthy bounce rate depends on your website type, industry, and user intent.
In general, a bounce rate between 40%–60% is considered a strong and realistic range for most websites. This aligns closely with the average website bounce rate, which typically sits around the mid-40% range across industries.
However, a “healthy” bounce rate should always be evaluated in context. A blog or informational page may perform well with a higher bounce rate, while a service or eCommerce website should aim for lower engagement drop-off to drive conversions.
Is a 70% bounce rate good?
A 70% bounce rate is not automatically good or bad; it depends on the type of page and user intent.
For content-heavy pages such as blog posts or news articles, a 70% bounce rate can still be acceptable if users are finding value quickly and leaving satisfied.
However, for service pages, landing pages, or eCommerce websites, a 70% bounce rate often signals missed opportunities. In these cases, it may indicate issues with user experience, messaging, or traffic quality.
To properly evaluate performance, compare your data against the average bounce rate by industry benchmarks rather than relying on a single number.
What's a bad bounce rate?
A “bad” bounce rate is one that is significantly higher than your industry benchmark and negatively impacts your business goals.
For most websites, anything above 60%–70% may require further investigation, especially if the page is designed to drive engagement or conversions.
However, bounce rate alone does not define performance. A page with a higher bounce rate but strong conversions may still be successful, while a page with a lower bounce rate but poor results may need optimization.
The key is to evaluate bounce rate in relation to user intent and overall outcomes.
Can bounce rate be improved?
Yes, bounce rate can absolutely be improved, but the goal should not be to lower the number artificially.
Instead, focus on improving the overall user experience and aligning your website with visitor expectations. When users find your content relevant, easy to navigate, and valuable, engagement naturally increases.
Improving bounce rate is ultimately about improving how users interact with your website, not just reducing exits.
Why is my website's bounce rate so high?
A high bounce rate is usually caused by a mismatch between user expectations and what your website delivers.
Common reasons include slow page load speeds, poor mobile optimization, unclear messaging, weak content, or lack of direction for the user.
In many cases, the issue is not the traffic itself, but what happens after users land on the page. If the experience does not immediately meet their needs, they are more likely to leave without engaging further.
Identifying the root cause is key to improving performance.
How to reduce website bounce rate?
To how to reduce website bounce rate, businesses should focus on improving key areas that influence user behaviour.
Start by optimizing page speed to ensure fast load times. Then refine your design to create a clean, intuitive user experience. Align your content with user intent so visitors immediately find what they are looking for.
Adding clear calls-to-action and internal links can also guide users toward the next step, encouraging deeper engagement.
When these elements work together, bounce rate improves naturally as part of a stronger overall website experience.
How does bounce rate affect SEO?
Bounce rate is not a direct ranking factor in Google’s algorithm, but it plays an indirect role in SEO performance.
A high bounce rate can signal that users are not finding your content relevant or engaging, which may lead to lower dwell time and reduced overall engagement signals.
Search engines prioritize user experience, so pages that fail to meet user expectations may struggle to maintain strong rankings over time.
Improving bounce rate often leads to better engagement, longer session durations, and stronger overall SEO performance.
What is the industry standard for website bounce rate?
The industry standard varies significantly depending on the type of website.
On average, the average website bounce rate sits around 45%–50%, but this number changes based on industry, content type, and user intent.
For example, content-heavy industries often have higher bounce rates, while transactional industries like eCommerce and real estate tend to have lower rates.
To accurately assess performance, always compare your data against average bounce rate by industry benchmarks rather than relying on a universal standard.


%20-%20Text%20%26%20Icon%20-%20White%20(PNG)_edited.png)
Comments